The Santa Claus Rally (SCR) is a popular topic of discussion this time of year.
Along with the SCR chatter comes this popular aphorism: “If Santa Claus should fail to call, bears may come to Broad and Wall.” Is this rule of thumb correct?
Since 1970, the SCR occurred 34 of 46 years, or 73.9% of the time (SCR numbers are based on the S&P 500, last five trading days of the old year and first two trading days of the new year).
If used as a full-year barometer (as the SCR goes, so goes the following year), the SCR has an accuracy ratio of 64.4%.
This sounds decent, but it’s actually quite lousy for two reasons:
- Since 1970, the S&P 500 has recorded 35 annual gains. The stock market’s bias is generally bullish and in harmony with 34 SCRs.
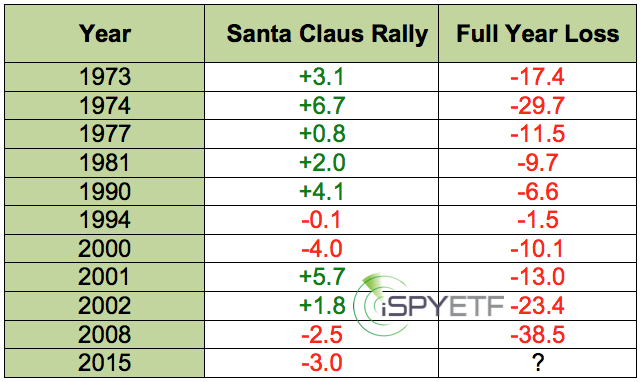
- The SCR’s track record in down years is dismal.
Since 1970, the S&P has suffered 10 annual losses. Only 2 of those 10 losses were preceded by negative SCRs. The table below shows all the details.

Based on our major market top indicator, there’s trouble ahead for 2016. However, based on statistical evidence, we won’t be able to use the SCR (or absence of SCR) as on early confirmation of the major market top indicator.
As long as the bullish divergence and support at 1,993 hold, positive December seasonality deserves the benefit of the doubt.
Simon Maierhofer is the publisher of the Profit Radar Report. The Profit Radar Report presents complex market analysis (S&P 500, Dow Jones, gold, silver, euro and bonds) in an easy format. Technical analysis, sentiment indicators, seasonal patterns and common sense are all wrapped up into two or more easy-to-read weekly updates. All Profit Radar Report recommendations resulted in a 59.51% net gain in 2013 and 17.59% in 2014.
Follow Simon on Twitter @ iSPYETF or sign up for the FREE iSPYETF Newsletter to get actionable ETF trade ideas delivered for free.
