Did stocks rally too far too fast, or can they continue their pace and rally into the New Year? The Dow Jones chart may hold the answer as it identifies what could be a clear point of ruin.
The ‘pop and drop’ is as annoying as it is effective. The pop and drop routine is one of many tricks the stock market uses to separate investors from their hard-earned money.
The pop happened Wednesday after the FOMC announcement when the S&P 500 (SNP: ^GSPC) and Dow Jones popped 1.5%+. The dreaded drop could happen at any time.
However, if the drop doesn’t happen shortly after the pop, the routine turns into a pop and linger, which generally leads to higher highs.
The whole pop and drop or pop and linger routine may sound overly simplified. In reality they are solidly based on facts, very effective and explained (with charts) in detail here: The QE Bull Market Pattern that Almost Never Fails
Risk Management and Confidence Booster
Is there a price level that would invalidate the pop and drop concern?
Probably.
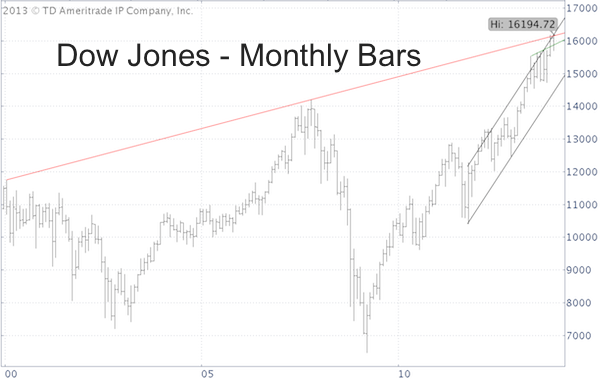
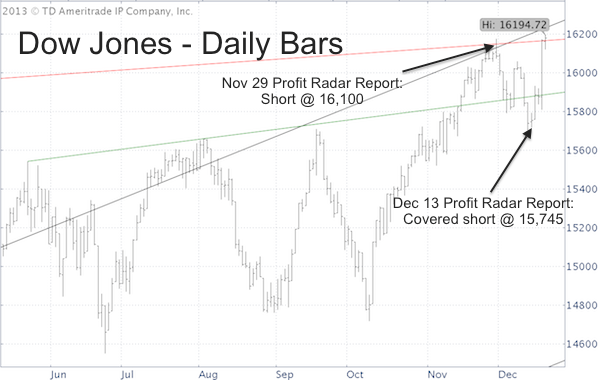
The two charts below provide a macro and micro outlook for the Dow Jones (DJI: ^DJI).
The monthly bar chart shows the origin of the current support/resistance provided by the 13-year red line and 26-month black channel.

The daily bar chart zooms in on the current location of those support/resistance levels.

We just saw a couple of weeks ago that the Dow respects those levels, particularly the red trend line.
The November 27 Profit Radar Report stated that: “A temporary correction in early December is becoming more likely.” Based on the 13-year trend line resistance we went short at Dow 16,100 and covered our shorts at Dow 15,745. Quite curiously, the Dow hit our down side target when 'nobody was looking.'
For an insightful commentary on how the Dow hit its down side target concealed from Wall Street's eyes, and why stocks were supposed to rally, go here: What the Dow and S&P Did When Nobody Was Looking
We have been using the Dow Jones (NYSEArca: DIA) as our gauge, because it offered clearer support/resistance levels than the S&P 500 or other indexes.
The temporary correction came and left and now the Dow Jones is back above its 13-year trend line, which is short-term bullish for the Dow, S&P 500 (NYSEArca: SPY) and especially small caps.
The Dow’s red trend line should be used as stop-loss level, because bullish sentiment will eventually catch up with stocks.
What’s next for 2014? We’ll soon find out, thanks to a barometer that has a 100% accuracy ratio (correct 17 out of 17 times).
The 100% Accurate Barometer Forecast for 2014
Simon Maierhofer is the publisher of the Profit Radar Report. The Profit Radar Report presents complex market analysis (stocks, gold, silver, euro and bonds) in an easy format. Technical analysis, sentiment indicators, seasonal patterns and common sense are all wrapped up into two or more easy-to-read weekly updates. We are accountable for our work, because we track every recommendation (see track record below).
Follow Simon on Twitter @ iSPYETF or sign up for the FREE iSPYETF Newsletter to get actionable ETF trade ideas delivered for free.
