From HotelNewsNow.com: STR: US results for week ending 9 November
The U.S. hotel industry posted positive results in the three key performance measurements during the week of 3-9 November, according to data from STR.
In year-over-year measurements, the industry’s occupancy increased 2.5 percent to 64.1 percent. Average daily rate rose 3.1 percent to finish the week at US$111.35. Revenue per available room for the week was up 5.7 percent to finish at US$71.34.
emphasis added
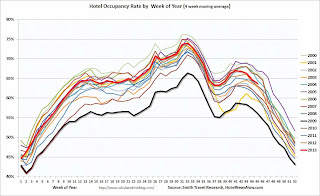
The 4-week average of the occupancy rate is close to normal levels.
Note: ADR: Average Daily Rate, RevPAR: Revenue per Available Room.
The following graph shows the seasonal pattern for the hotel occupancy rate using the four week average for the year 2000 through 2013.
 Click on graph for larger image.
The red line is for 2013 and black is for 2009 – the worst year since the Great Depression for hotels.
Note: Although 2009 was the worst year since the Depression, there was a brief period in 2001 when the occupancy rate was even lower than in 2009 due to the attacks on 9/11. In 2005, the occupancy rate was very high at the end of the year due to Hurricanes Katrina and Rita.
Through November 9th, the 4-week average of the occupancy rate is slightly higher than the same period last year and is tracking at pre-recession levels.
This has been a solid year for the hotel industry (although the government shutdown hurt for a few weeks in October).
Data Source: Smith Travel Research, Courtesy of HotelNewsNow.com