NOTE: Calculated Risk blog is loading slowly for some readers. This is apparently a problem with either Google or Amazon hosting, and is currently being investigated.
Another update on hotels from HotelNewsNow.com: STR: US results for week ending 7 September
In year-over-year comparisons, occupancy fell 1.9 percent to 56.5 percent, average daily rate was down 0.4 percent to US$102.58, and revenue per available room decreased 2.3 percent to US$57.98.
“Rosh Hashanah and Labor Day had an adverse effect on hotel performance last week,” said Jan Freitag, senior VP of strategic development at STR. “RevPAR declined as both ADR and occupancy dropped from the same week last year. Of all the Chain Scales, only Economy properties reported a very slight lift in RevPAR. The last end of summer vacation rush lifted resort RevPAR by 3.9 percent, driven by a 5.8-percent increase in ADR.”
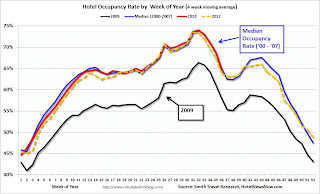
The 4-week average of the occupancy rate is close to normal levels.
Note: ADR: Average Daily Rate, RevPAR: Revenue per Available Room.
The following graph shows the seasonal pattern for the hotel occupancy rate using the four week average.
 Click on graph for larger image.
The red line is for 2013, yellow is for 2012, blue is “normal” and black is for 2009 – the worst year since the Great Depression for hotels.
Through September 7th, the 4-week average of the occupancy rate is slightly higher than the same period last year and is tracking the pre-recession levels. The 4-week average of the occupancy rate will decrease over the next few weeks, before increasing again in the Fall. Overall, this has been a decent year for the hotel industry.
Data Source: Smith Travel Research, Courtesy of HotelNewsNow.com